1.7 KiB
FlashInfer Profiler (Experimental)
FlashInfer Profiler is a tool for intra-kernel profiling for diagnosing kernel performance.
Prerequisites
The Chrome tracing do not support overlapping events inside a single thread (the wgmma instructions are asynchronous, and the execution of several wgmma instructions might overlap). We use our fork of tg4perfetto, modified to use the latest protobuf, to generate perfetto traces.
# pip install from github
pip install protobuf
pip install git+https://github.com/flashinfer-ai/tg4perfetto.git
Examples
MLA
Run the following command to profile the MLA kernel for different configurations.
python mla.py --batch-size 64 --seq-len 1024 --num-heads 128 --profiler-buffer-size 1048576
The generated traces will be saved in the current directory.
ls *.perfetto-trace
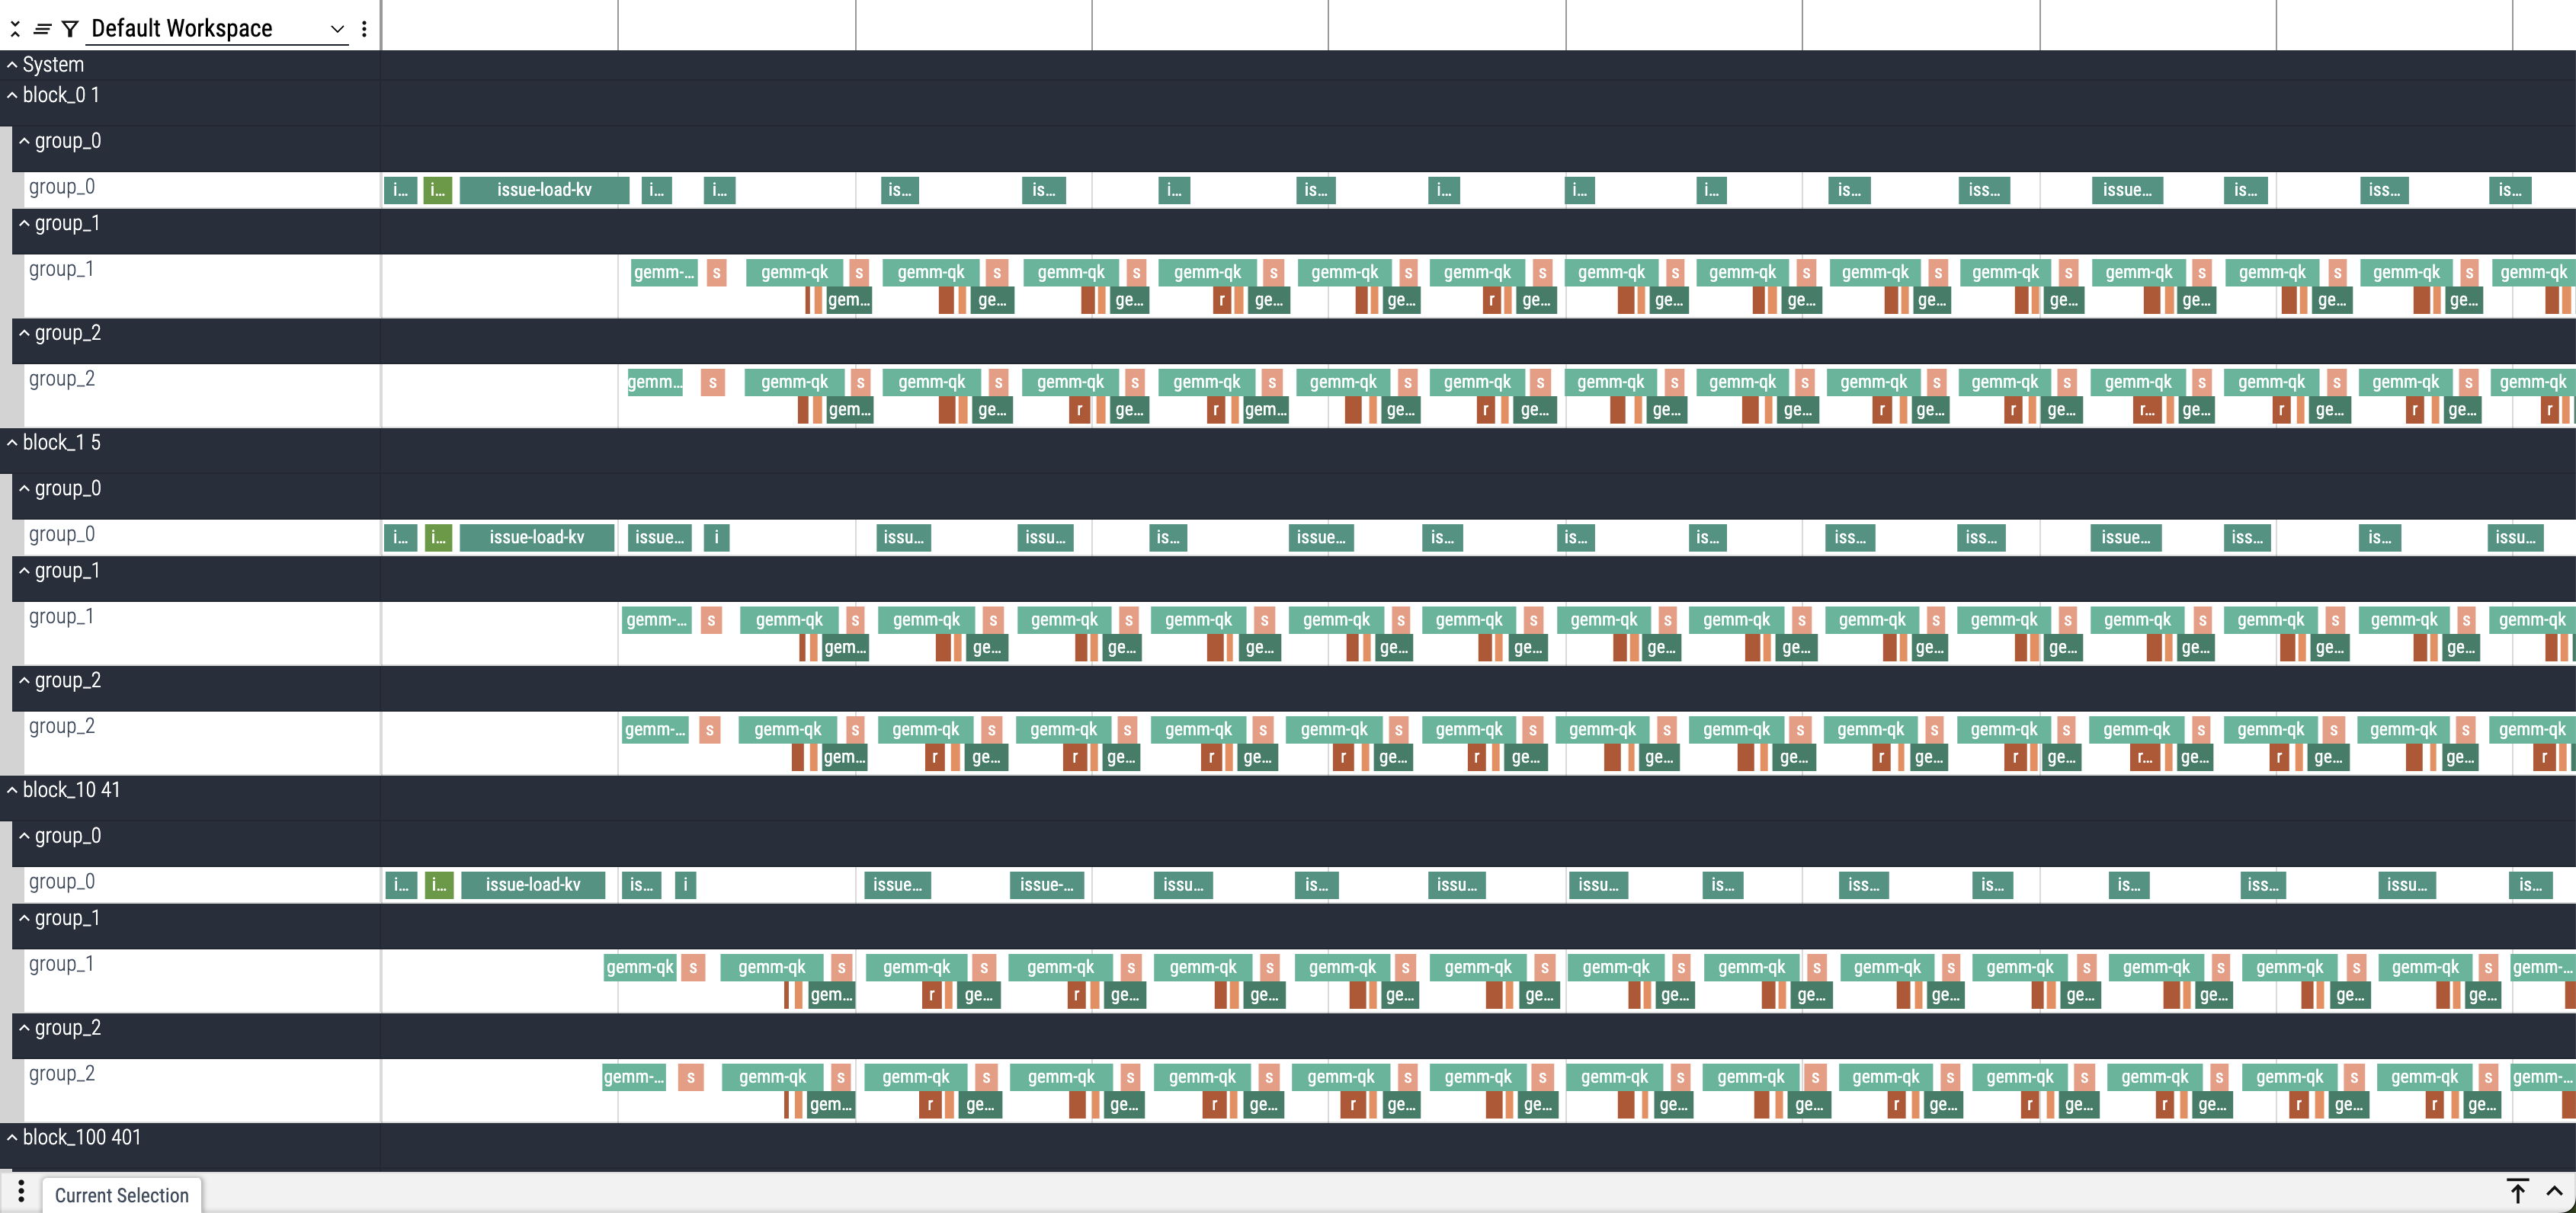
User can use ui.perfetto.dev to visualize the traces.
Below is a screenshot of the trace generated by the above command.
Limitations
- The instrumentation is intrusive (we insert
__threadfence_block()in the kernel to avoid instruction reordering) and will slow down the kernel execution.
Acknowledgements
This work is in-part inspired by Mosaic GPU DSL's warp-level profiling, as well as Proton Intra-kernel profiling in Triton.
We thank tg4perfetto for providing examples of generating perfetto traces from python.