46 lines
1.7 KiB
Markdown
46 lines
1.7 KiB
Markdown
# FlashInfer Profiler (Experimental)
|
|
|
|
FlashInfer Profiler is a tool for intra-kernel profiling for diagnosing kernel performance.
|
|
|
|
## Prerequisites
|
|
|
|
The Chrome tracing do not support overlapping events inside a single thread (the wgmma instructions are asynchronous, and the execution of several wgmma instructions might overlap). We use our fork of [tg4perfetto](https://github.com/ihavnoid/tg4perfetto), modified to use the latest protobuf, to generate perfetto traces.
|
|
|
|
```bash
|
|
# pip install from github
|
|
pip install protobuf
|
|
pip install git+https://github.com/flashinfer-ai/tg4perfetto.git
|
|
```
|
|
|
|
## Examples
|
|
|
|
### MLA
|
|
|
|
Run the following command to profile the MLA kernel for different configurations.
|
|
|
|
```bash
|
|
python mla.py --batch-size 64 --seq-len 1024 --num-heads 128 --profiler-buffer-size 1048576
|
|
```
|
|
|
|
The generated traces will be saved in the current directory.
|
|
|
|
```bash
|
|
ls *.perfetto-trace
|
|
```
|
|
|
|
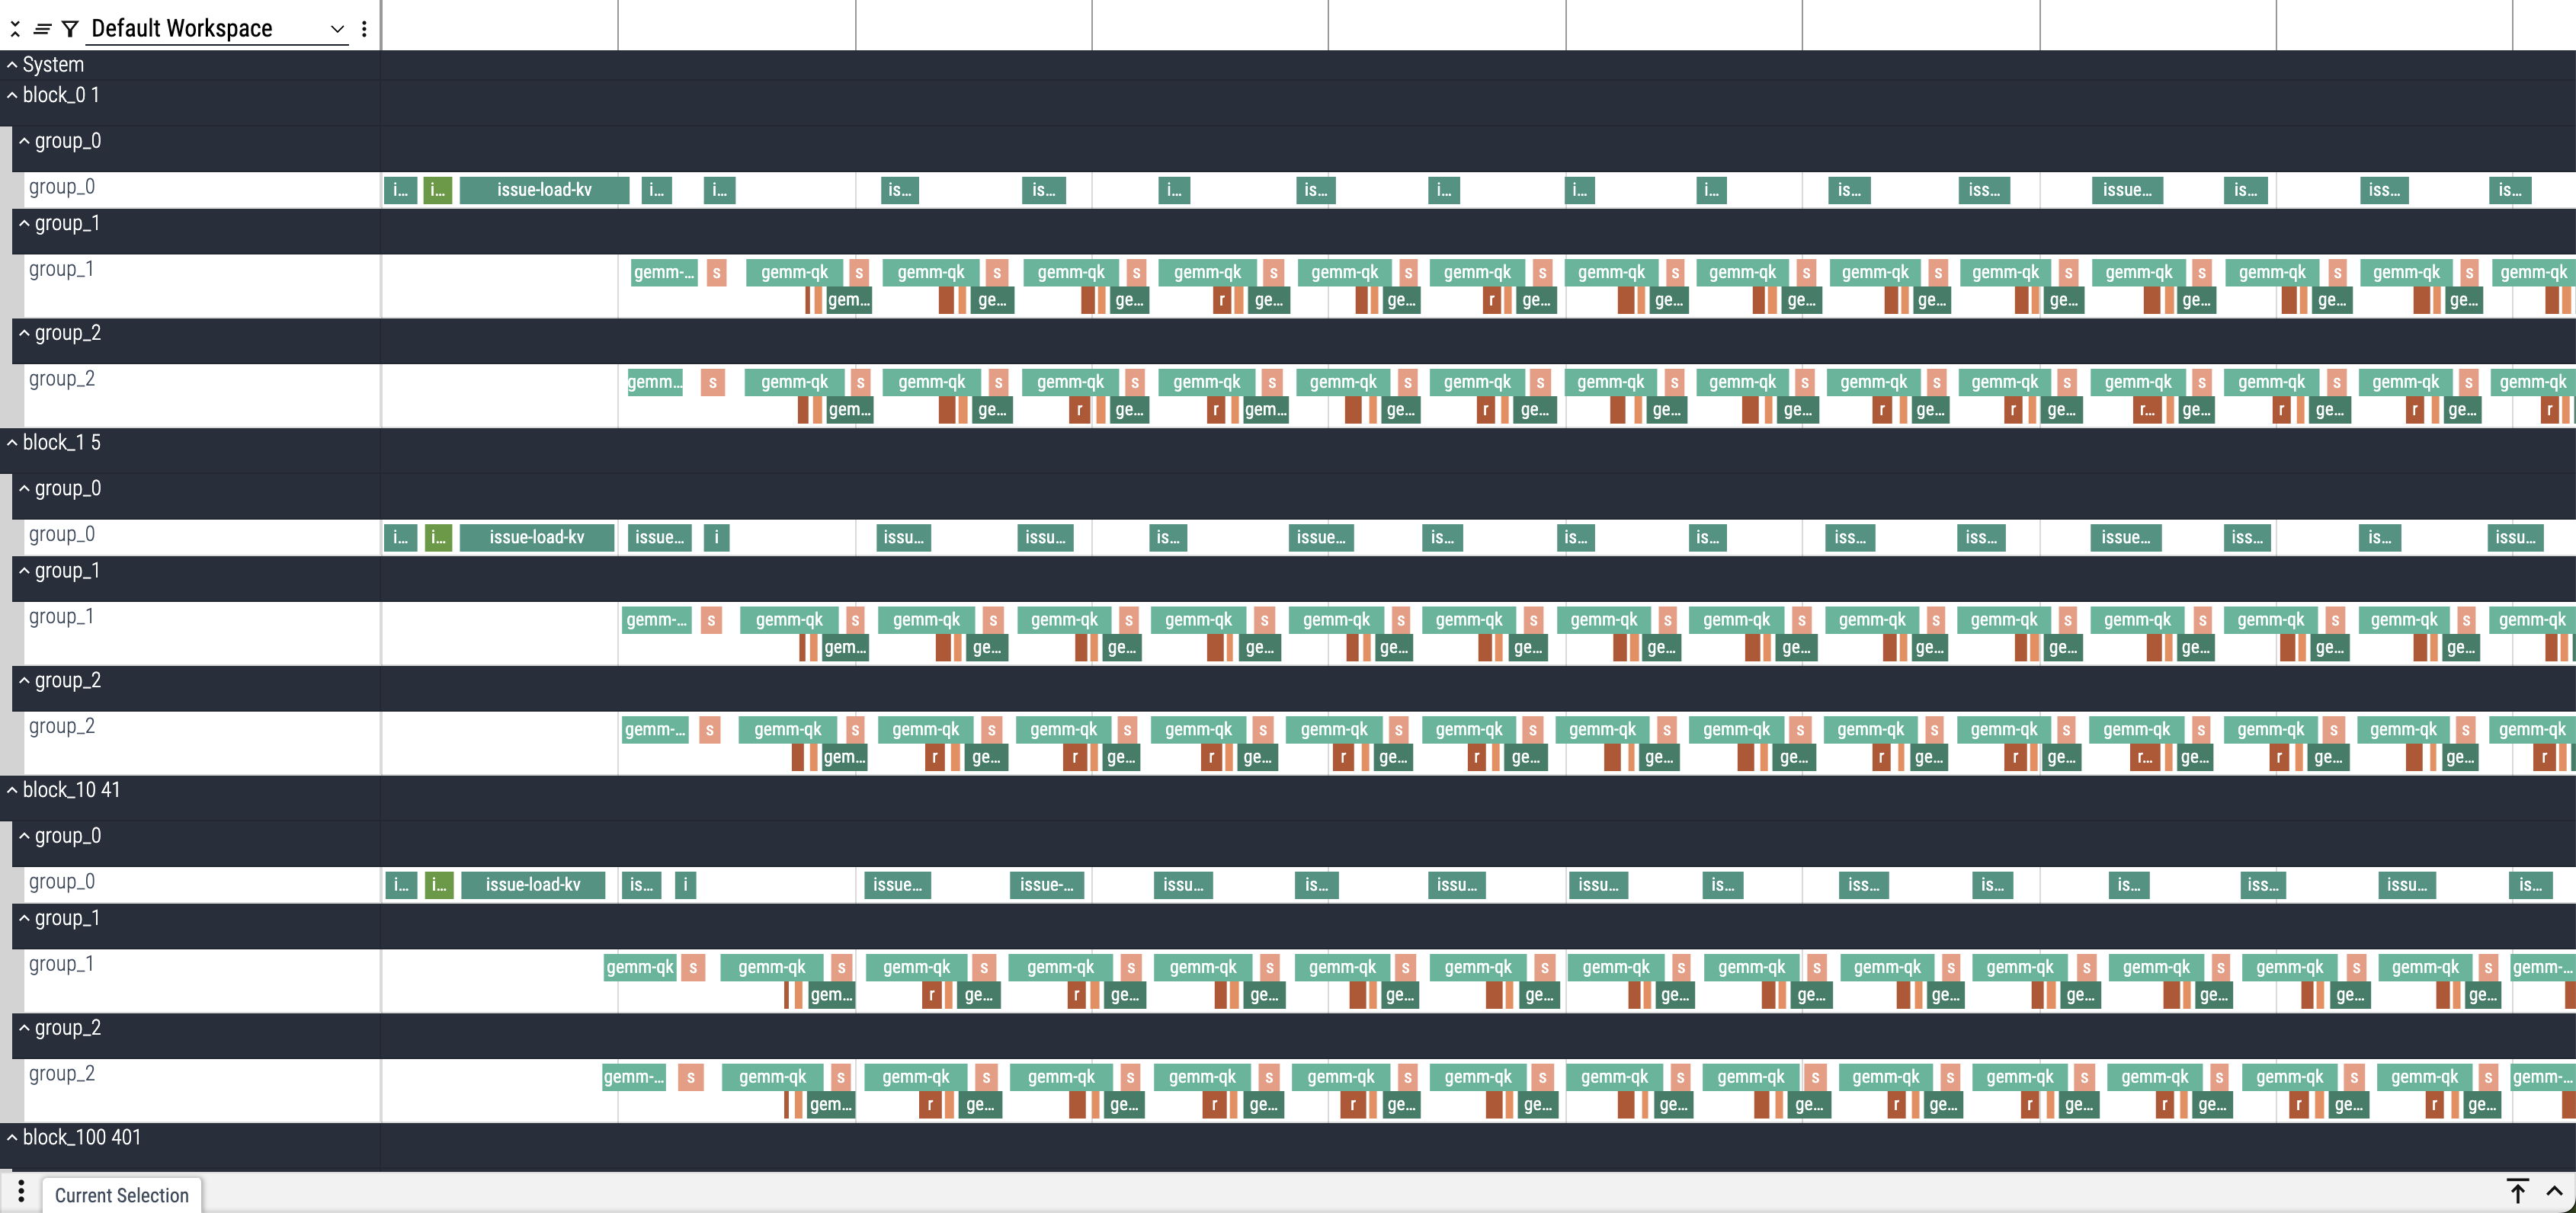
User can use [ui.perfetto.dev](https://ui.perfetto.dev/) to visualize the traces.
|
|
|
|
Below is a screenshot of the trace generated by the above command.
|
|
|
|
|
|
|
|
## Limitations
|
|
|
|
- The instrumentation is intrusive (we insert `__threadfence_block()` in the kernel to avoid instruction reordering) and will slow down the kernel execution.
|
|
|
|
## Acknowledgements
|
|
|
|
This work is in-part inspired by [Mosaic GPU DSL](https://github.com/jax-ml/jax/tree/main/jax/experimental/mosaic)'s warp-level profiling, as well as [Proton Intra-kernel profiling](https://github.com/triton-lang/triton/pull/4861) in Triton.
|
|
|
|
We thank [tg4perfetto](https://github.com/ihavnoid/tg4perfetto) for providing examples of generating perfetto traces from python.
|